Explore+ is the foundation of the Pine-Sports website. Explore+ is a high powered data analytics tool for manually analyzing hundreds of different game, team, and player statistics across all four major sports. For this section on ways to use Explore, we will use the NBA to show examples of how you can view and compare team stats over time, view player totals against specific opponents, make defensive comparisons against specific positions, and analyze spreads and totals over time.

Comparing Team Stats Over Time
The first step is to find the Explore Player & Team Stats button at the top of the Pine-Sports home page. Click on the team of your choosing, which for this walkthrough will be the NBA.

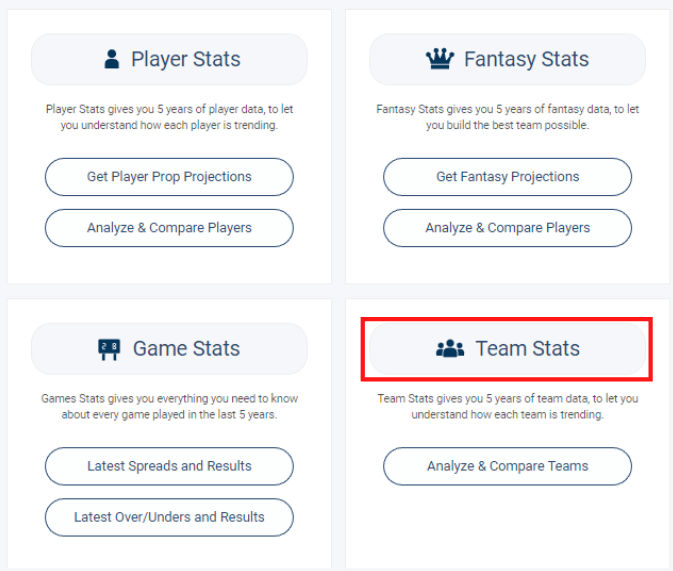
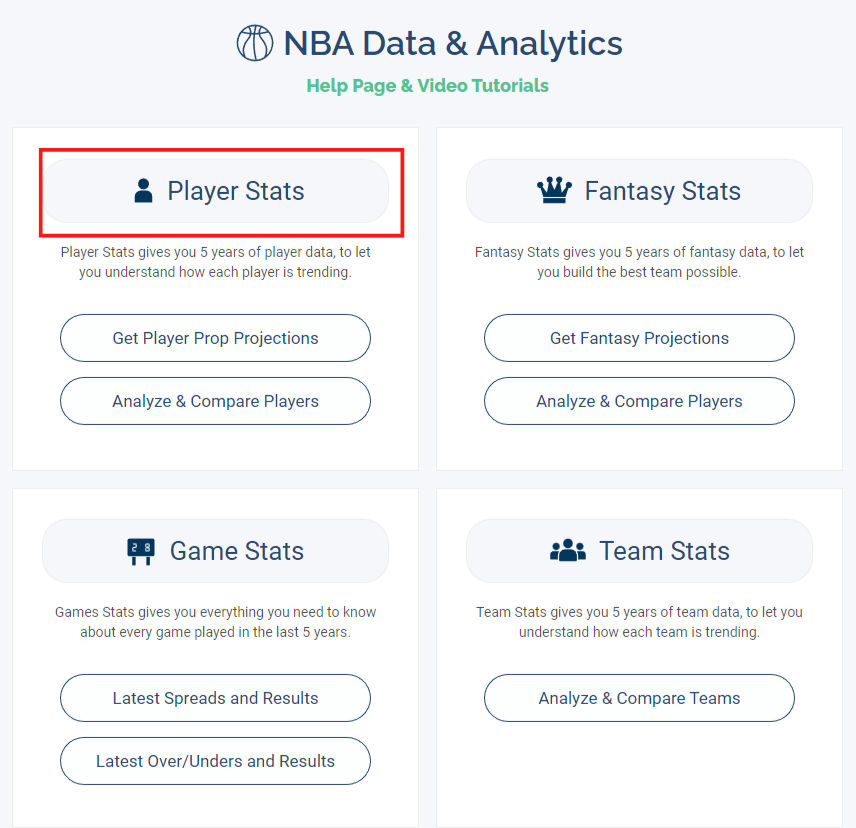
Once in the Explore+ Dashboard for the NBA, you will have 4 options: Player Stats, Fantasy Stats, Game Stats, and Team stats with each one involving a unique data set. We will go through ways to use each one, but for now let’s start in the Team Stats category at the bottom right.

Now that you’ve clicked team stats, the View screen for NBA Team Data will be opening. In View, you can filter out any column that you see by clicking on the column header and filling out the options. For example, we first want to filter the 16,000+ lines of data for only games in the current season, 2022-2023. Find the ‘Season’ column and click the column header, then in the dropdown select ‘2022-2023’.

Now click the ‘Visualize’ button just above the row of column headers. You will see the filter we added in the View screen carries over in the ‘Query’ of the Visualize screen. We need to set up the rest of the section to generate a chart though:
- Let’s change the type of Line to Bar at the top
- Leave the query as it is
- Change X to == ‘Team’
- Change Y to == ‘Team - Score’ and ‘Opponent - Score’
- Change Aggregation to == ‘Mean’
- Change Barsort to == ‘Team - Score’

Setting this up as shown above will generate the following chart which shows each team’s average score for and against up to this point in the 2022-2023 season, in order of highest average team score:

This is a quick and easy way to compare team averages over the season. Let’s view it over a different time frame by only changing one single piece of the initial inputs. Rather than filtering by Season we can add a date filter using this format: ‘MM-DD-YYYY’. Go up to the query and add the following at the very beginning:
Date >= ‘01-01-2023’ and

The graph that generates now displays team average scores for and against in games of the 22-23 season that occurred no sooner than January 1st. If you want February 1st, it would be ‘02-01-2023’ or December 7th would be ‘12-07-2022’.
This same process can be used to analyze anything found in the dropdown above for the ‘Y’ including but far from limited to:
Team and Opponent Score
Team and Opponent 1st, 2nd, 3rd, and 4th Quarter Points
Team and Opponent Two Pointers, Three Pointers or Free Throws Made, Attempted, Percentage Made or Attempt Rate
Team and Opponent Fouls
Team and Opponent Effective Field Goal shooting or True Shooting Percentages
Team and Opponent Turnovers, Steals, or Blocks
Team and Opponent Offensive and Defensive Ratings
And much, much more.
Viewing Player Stats Against Specific Opponents

Now that we've looked at team stats, let’s check out some player stats. The player stats section on your NBA dashboard is a unique data set that includes those same team and opponent stats from the previous section with the addition of each player’s data from each game going back to the 2017 season. Go back to your dashboard, and click player stats to get started.
Once in the Player Stats section, you will see the familiar ‘View’ screen from the previous team stats example but this time with over 160,000 lines of data instead of the 16,000 from before
The process will be the same, but the execution will be a little different. Just for an example’s sake, we are going to look at Luka Doncic's stats against the Memphis Grizzlies. You can do this with any player against any team.
- In the View section, scroll through the columns until you find ‘Player Name’ and filter just for Luka Doncic.
- Now scroll back to find Opponent column and select just ‘Memphis’ from the dropdown.
- You will now see just 11 games now out of the 160,000 lines that include Luka Doncic playing against the Grizzlies. Time to click ‘Visualize’ and

As before, you will see that our filters carried over into the query and it should read out: Player Name == ‘Luka Doncic’ and Opponent == ‘Memphis’
Now let’s fill out the rest to generate a chart!
- Change it from ‘Line’ to ‘Bar’ at the top
- Leave the Query as it is
- Change X to == ‘Date’
- Change Y to == ‘Player - Points’, ‘Player - Total Rebounds’, and ‘Player - Assists’
- Change Barmode to == ‘Stack’

Setting this up as shown above will generate a chart that shows Luka’s Points, Total Rebounds, and Assists in each of the 11 games against Memphis going back through Pine’s entire database. You can interchange the points, rebounds, and assists with any of the other player stats you would like to view. Or try changing Player Name to somebody else! It’s very case sensitive so if you ever have issues just go back to ‘View’ and use the column headers.

Just like that, we can see that Luka has 20+ points against Memphis in 9 of 11 meetings, has a PAR of 40+ in each of the last 4 and 50+ in 2 of his last 3. Definitely seems to me that he could be ‘figuring them out’ a little with the recent boost in numbers.
In the next edition we will do comparable walk throughs in the Game Stats and Fantasy Stats sections! Give it a try yourself with the new knowledge and share with us what you find!
Explore+ is the foundation of the Pine-Sports website. Explore+ is a high powered data analytics tool for manually analyzing hundreds of different game, team, and player statistics across all four major sports. For this section on ways to use Explore, we will use the NBA to show examples of how you can view and compare team stats over time, view player totals against specific opponents, make defensive comparisons against specific positions, and analyze spreads and totals over time.
Comparing Team Stats Over Time
The first step is to find the Explore Player & Team Stats button at the top of the Pine-Sports home page. Click on the team of your choosing, which for this walkthrough will be the NBA.
Once in the Explore+ Dashboard for the NBA, you will have 4 options: Player Stats, Fantasy Stats, Game Stats, and Team stats with each one involving a unique data set. We will go through ways to use each one, but for now let’s start in the Team Stats category at the bottom right.
Now that you’ve clicked team stats, the View screen for NBA Team Data will be opening. In View, you can filter out any column that you see by clicking on the column header and filling out the options. For example, we first want to filter the 16,000+ lines of data for only games in the current season, 2022-2023. Find the ‘Season’ column and click the column header, then in the dropdown select ‘2022-2023’.
Now click the ‘Visualize’ button just above the row of column headers. You will see the filter we added in the View screen carries over in the ‘Query’ of the Visualize screen. We need to set up the rest of the section to generate a chart though:
Setting this up as shown above will generate the following chart which shows each team’s average score for and against up to this point in the 2022-2023 season, in order of highest average team score:
This is a quick and easy way to compare team averages over the season. Let’s view it over a different time frame by only changing one single piece of the initial inputs. Rather than filtering by Season we can add a date filter using this format: ‘MM-DD-YYYY’. Go up to the query and add the following at the very beginning:
Date >= ‘01-01-2023’ and
The graph that generates now displays team average scores for and against in games of the 22-23 season that occurred no sooner than January 1st. If you want February 1st, it would be ‘02-01-2023’ or December 7th would be ‘12-07-2022’.
This same process can be used to analyze anything found in the dropdown above for the ‘Y’ including but far from limited to:
Team and Opponent Score
Team and Opponent 1st, 2nd, 3rd, and 4th Quarter Points
Team and Opponent Two Pointers, Three Pointers or Free Throws Made, Attempted, Percentage Made or Attempt Rate
Team and Opponent Fouls
Team and Opponent Effective Field Goal shooting or True Shooting Percentages
Team and Opponent Turnovers, Steals, or Blocks
Team and Opponent Offensive and Defensive Ratings
And much, much more.
Viewing Player Stats Against Specific Opponents
Now that we've looked at team stats, let’s check out some player stats. The player stats section on your NBA dashboard is a unique data set that includes those same team and opponent stats from the previous section with the addition of each player’s data from each game going back to the 2017 season. Go back to your dashboard, and click player stats to get started.
Once in the Player Stats section, you will see the familiar ‘View’ screen from the previous team stats example but this time with over 160,000 lines of data instead of the 16,000 from before
The process will be the same, but the execution will be a little different. Just for an example’s sake, we are going to look at Luka Doncic's stats against the Memphis Grizzlies. You can do this with any player against any team.
As before, you will see that our filters carried over into the query and it should read out: Player Name == ‘Luka Doncic’ and Opponent == ‘Memphis’
Now let’s fill out the rest to generate a chart!
Setting this up as shown above will generate a chart that shows Luka’s Points, Total Rebounds, and Assists in each of the 11 games against Memphis going back through Pine’s entire database. You can interchange the points, rebounds, and assists with any of the other player stats you would like to view. Or try changing Player Name to somebody else! It’s very case sensitive so if you ever have issues just go back to ‘View’ and use the column headers.
Just like that, we can see that Luka has 20+ points against Memphis in 9 of 11 meetings, has a PAR of 40+ in each of the last 4 and 50+ in 2 of his last 3. Definitely seems to me that he could be ‘figuring them out’ a little with the recent boost in numbers.
In the next edition we will do comparable walk throughs in the Game Stats and Fantasy Stats sections! Give it a try yourself with the new knowledge and share with us what you find!
Share your best bets!