In a post I wrote earlier this week I talked about the importance of making value bets to maximize return (and preservation of capital) -- below, I highlight the top three value bets based on my Predict NBA Winner model, which is currently has a 66.7% accuracy score, and which has a model efficiency of over 70% (more on that below).
 Value betting is one of the best ways to maximize profits and preserve capital.
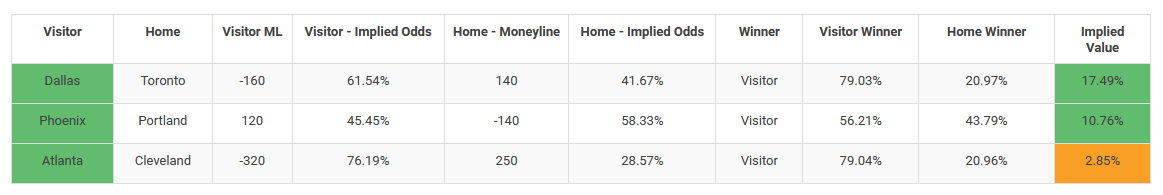
 Below in green are tonight's top three money line value bets for the NBA, along with the implied player value or "edge" if you take the ML.
Now let's have a chat about model efficiency. When you run a Predict model you'll notice you get a "score." This is the percent correct of real games your model was able to correctly predict -- after you build a model, Predict will take real historical NBA games, use your model to predict those outcomes, and then count how many games your model correctly predicted -- hint: you can view these predictions if you click on your model score in Predict.
Now here's the fun part. What if we want to know how many games my model correctly predicts based on the probability it assigned for that game. For example, in the above value chart, my model predicts Dallas winning 79% of the time. But it would be useful to know how often the model is right when it assigns a certain probability to an event. This is generally a measure of model efficiency. Below are two pie charts detailing my model efficiency for when my model assigns a probability of 65% or more and 70% or more:
This first chart shows us how many winners my model correctly predicted when the probability score for that team was greater than 65%: here my model correctly predicted the winner of NBA games 70.7% of the time when it assigned a probability to that team winning which was greater than 65%! That's a really good sign of a strong and efficient model, and it means it's a model we can "trust" in.
This pie chart shows the number of winners my model correctly predicted when it assigned a probability of greater than 70% to the winner. Again, this shows that my model correctly predicted the winners of NBA games 72.1% of the time when it believed the probability of that team winning was more than 70%! This makes sense, and is another signal of a strong and trustworthy model.
Finally, I wanted to see whether there were any interesting relationships for the games that my model correctly predicted. I took all the home and visitor games my model correctly predicted, and graphed that as a function of the points the home and visitor teams scored to get a sense of mean scores for games my model had correctly predicted. Those graphs are below, one for home team score and one for visitor team score.
What's remarkable is that you get a nearly perfect bell curve in both instances, with a slight skew for Visitor team scores. You can see that the median score for the Home team is about 113 points and around 110 for Visitor teams. I thought this was pretty remarkable as it shows the distribution of winning team scores. Enjoy the data and make sure to hover over the bell curves to see the actual scores for the data points.
In a post I wrote earlier this week I talked about the importance of making value bets to maximize return (and preservation of capital) -- below, I highlight the top three value bets based on my Predict NBA Winner model, which is currently has a 66.7% accuracy score, and which has a model efficiency of over 70% (more on that below).
Below in green are tonight's top three money line value bets for the NBA, along with the implied player value or "edge" if you take the ML.
Now let's have a chat about model efficiency. When you run a Predict model you'll notice you get a "score." This is the percent correct of real games your model was able to correctly predict -- after you build a model, Predict will take real historical NBA games, use your model to predict those outcomes, and then count how many games your model correctly predicted -- hint: you can view these predictions if you click on your model score in Predict.
Now here's the fun part. What if we want to know how many games my model correctly predicts based on the probability it assigned for that game. For example, in the above value chart, my model predicts Dallas winning 79% of the time. But it would be useful to know how often the model is right when it assigns a certain probability to an event. This is generally a measure of model efficiency. Below are two pie charts detailing my model efficiency for when my model assigns a probability of 65% or more and 70% or more:
This first chart shows us how many winners my model correctly predicted when the probability score for that team was greater than 65%: here my model correctly predicted the winner of NBA games 70.7% of the time when it assigned a probability to that team winning which was greater than 65%! That's a really good sign of a strong and efficient model, and it means it's a model we can "trust" in.
This pie chart shows the number of winners my model correctly predicted when it assigned a probability of greater than 70% to the winner. Again, this shows that my model correctly predicted the winners of NBA games 72.1% of the time when it believed the probability of that team winning was more than 70%! This makes sense, and is another signal of a strong and trustworthy model.
Finally, I wanted to see whether there were any interesting relationships for the games that my model correctly predicted. I took all the home and visitor games my model correctly predicted, and graphed that as a function of the points the home and visitor teams scored to get a sense of mean scores for games my model had correctly predicted. Those graphs are below, one for home team score and one for visitor team score.
What's remarkable is that you get a nearly perfect bell curve in both instances, with a slight skew for Visitor team scores. You can see that the median score for the Home team is about 113 points and around 110 for Visitor teams. I thought this was pretty remarkable as it shows the distribution of winning team scores. Enjoy the data and make sure to hover over the bell curves to see the actual scores for the data points.
Your Sports IQ + AI = Pine Sports