🔒 Lock It In: Cowboys v. Vikings
I like a good underdog pick and that's why I'm taking the Cowboys over the Vikings tonight -- here's why I think the favored Vikings will succumb to the Cowboys.
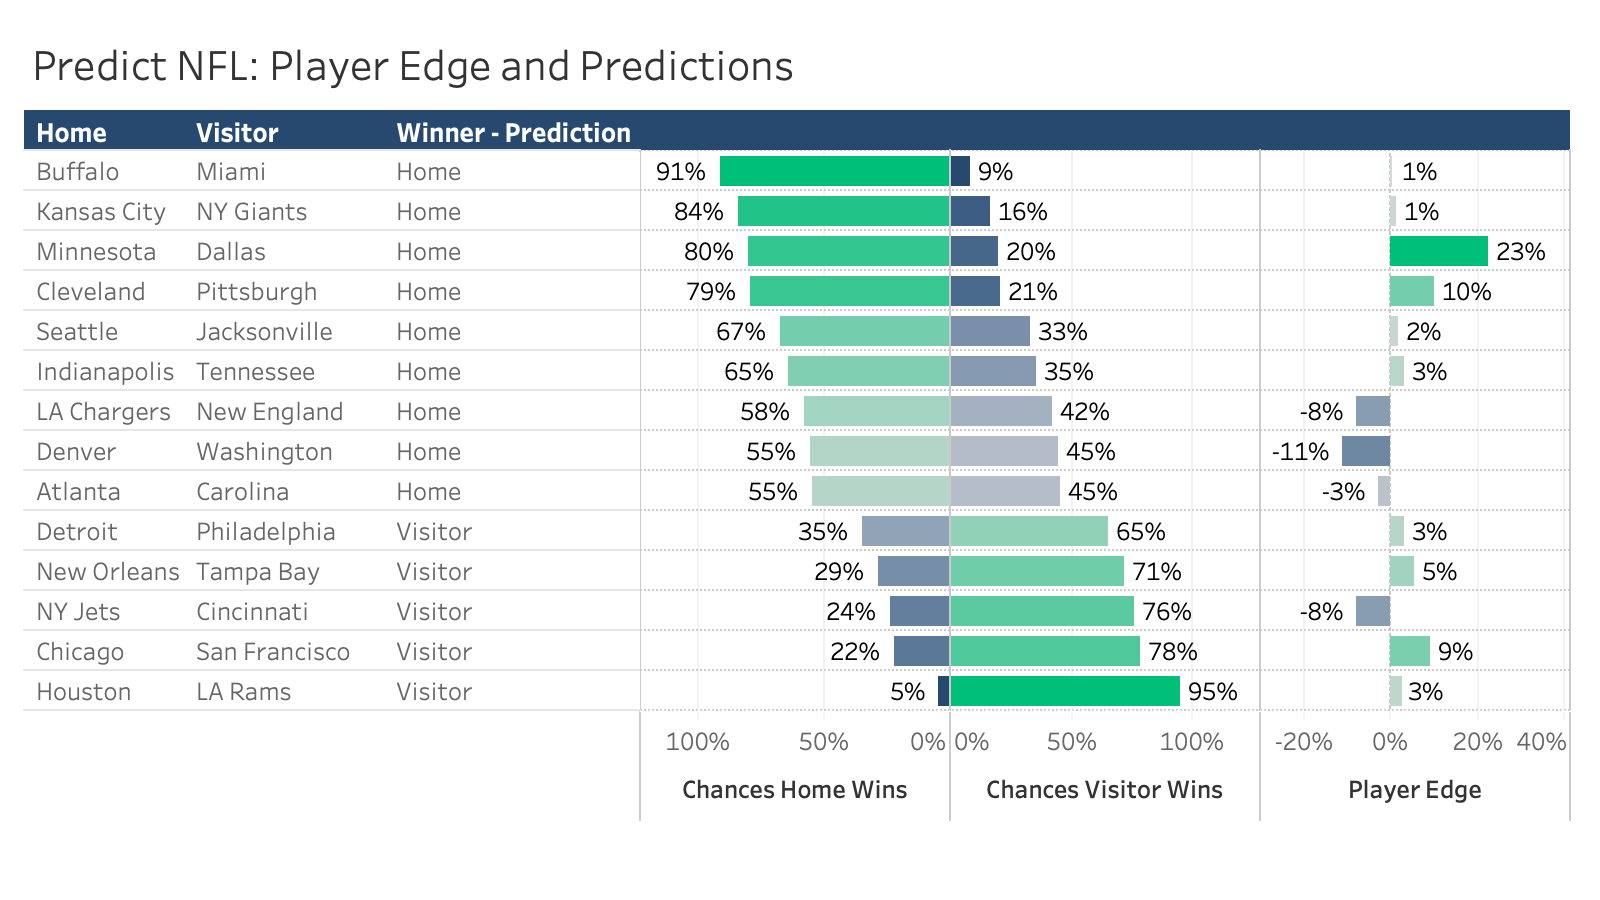
Although my Predict model has the Vikings winning 80% of the time I am going to venture to say that Dallas has a better than 20% of winning -- models are not meant to be full proof, and in fact, while my NFL model has a high accuracy of 68%, it still can be wrong 32% of the time. This is where Explore comes into play and the powerful charting and analytics tools that form a wholistic analysis of match-ups. I suggest to anyone using Predict to also validate your findings with Explore.
Now to the charts from Explore. Interestingly, I use 2nd and 4th quarter points scored in my Predict model. Using those two stats helped increase my model accuracy by almost 5%, which is huge. So it means there is good predictive value in using the 2nd and 4th quarter performance. Well, below is a quarter-by-quarter graph that shows how strong Dallas has been this season.
I also really like Dallas's passing yards this season, although they do give up more passing yards than the Vikings.
Finally, I really like Dallas's ability to get first downs and their third down's made edges just over the Vikings'. Should be an interesting game so let's see what happens.
I like a good underdog pick and that's why I'm taking the Cowboys over the Vikings tonight -- here's why I think the favored Vikings will succumb to the Cowboys.
Although my Predict model has the Vikings winning 80% of the time I am going to venture to say that Dallas has a better than 20% of winning -- models are not meant to be full proof, and in fact, while my NFL model has a high accuracy of 68%, it still can be wrong 32% of the time. This is where Explore comes into play and the powerful charting and analytics tools that form a wholistic analysis of match-ups. I suggest to anyone using Predict to also validate your findings with Explore.
Now to the charts from Explore. Interestingly, I use 2nd and 4th quarter points scored in my Predict model. Using those two stats helped increase my model accuracy by almost 5%, which is huge. So it means there is good predictive value in using the 2nd and 4th quarter performance. Well, below is a quarter-by-quarter graph that shows how strong Dallas has been this season.
I also really like Dallas's passing yards this season, although they do give up more passing yards than the Vikings.
Finally, I really like Dallas's ability to get first downs and their third down's made edges just over the Vikings'. Should be an interesting game so let's see what happens.
Your Sports IQ + AI = Pine Sports